01 · Understand
Case study · Cape Manufacturing · The proposals arrive
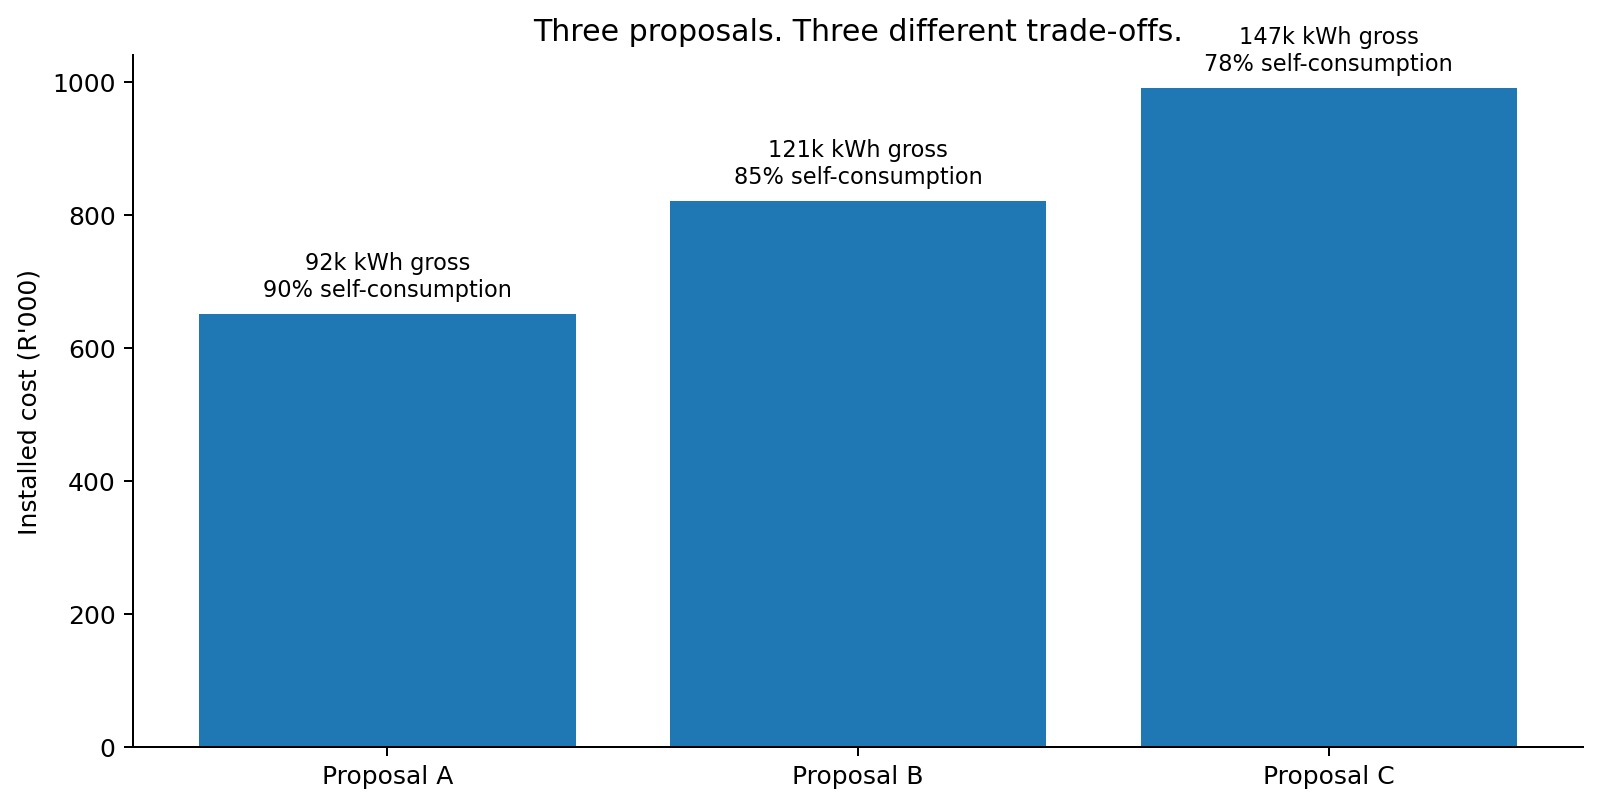
You have accepted the brief. The suppliers offer different combinations of installed cost, generation and self-consumption. In this case, electricity the factory cannot use when it is generated earns no revenue.
Before you open the spreadsheet …
Which measure would you inspect first if you had to advise the Financial Director?
Your choice is saved automatically on this device. You will revisit it on Reflect.
Stage outcome and evidence
Outcome for this stage: After completing this stage, you should be able to interpret the case data and explain how self-consumption affects the economic value of solar generation.
Evidence: your prediction response and concept-check explanation.
Course guidance · interpret the inputs
Price is only one part of the decision
A larger PV system can generate more electricity, but Cape Manufacturing only saves money on solar electricity it can use when it is produced. This makes self-consumption the bridge between technical output and economic value.
If a system generates 100 kWh while the factory can use only 80 kWh, its self-consumption is 80%. In this simplified case, unused generation has no economic value.
| Proposal | A | B | C |
|---|---|---|---|
| Installed cost | R650,000 | R820,000 | R990,000 |
| System size | 60 kWp | 80 kWp | 100 kWp |
| Year-1 generation | 92,000 kWh | 121,000 kWh | 147,000 kWh |
| Self-consumption | 90% | 85% | 78% |
| Year-1 maintenance | R9,000 | R11,000 | R14,000 |
Excel instruction · read cells, do not calculate yet
Use the Case Data sheet as your source of truth
- Click the Case Data sheet.
- Economic assumptions are in
A3:E9. ClickB4: the Formula Bar should show 2.8, the tariff in R/kWh. - Proposal inputs are in
A12:F17. System A is columnB, B isC, C isD. - Click
D15(147,000 kWh) and thenD16(78%). Note that the cell address changes in the Name Box.
Useful habit: never retype an input elsewhere if a formula can reference the original cell. This improves auditability and reduces inconsistent assumptions.
Check your understanding
Which system generates the most electricity, and which has the highest self-consumption? Explain why neither fact alone identifies the best investment.
Check your answer
System C has the highest gross generation (147,000 kWh). System A has the highest self-consumption (90%). Those facts do not, by themselves, identify the best investment.
Microsoft Excel · same task
Excel Use the sheet tabs at the bottom. Click a cell and read its address in the Name Box; read/edit the formula in the Formula Bar.
Google Sheets compatibility Use the sheet tabs at the bottom. Click a cell and read its address in the Name box at the left of the formula bar; read/edit the formula in the formula bar.
Completed: interpreted proposal inputs and recorded your initial judgement.
Next: learn the few Excel moves needed to build the model confidently.
Glossary & further reading · optional
- Photovoltaic (PV)
- Technology that converts sunlight into electricity, as used in the proposed rooftop solar panels.
- kW and kWp
- A kilowatt (kW) measures power: the rate of producing or using energy. Kilowatt-peak (kWp) states a solar array’s rated power under standard test conditions, not its guaranteed output at all times.
- Kilowatt-hour (kWh)
- A unit of energy: 1 kWh is the energy produced or used at a steady power of 1 kW for one hour. It measures an amount over time, unlike kW or kWp.
- Year-1 generation
- The total electricity expected from the system in its first year, measured in kWh. Only the portion the factory can use when generated reduces grid purchases in this case.
- Self-consumption
- The proportion of solar electricity Cape Manufacturing uses itself when it is generated, rather than exporting or wasting it. Higher self-consumption generally increases savings in this model.
- Electricity tariff
- The price charged for electricity; this model uses a single assumed rand amount per kWh of grid electricity avoided. Real South African bills can include other charges.
- Installed cost
- The upfront amount for purchasing and installing the solar system. Annual maintenance is a separate cost in the case data.
- Auditability
- The ability to trace a result back through its formulas to the original inputs, so someone else can check it.
Further reading
City of Cape Town — Going solar
Local guidance on solar photovoltaic generation and reducing grid electricity purchases.
Read the resource ↗Eskom — Tariffs and charges
South African tariff categories and links to pricing documents; the course tariff remains an illustrative assumption.
Read the resource ↗